This material is marketing communication.
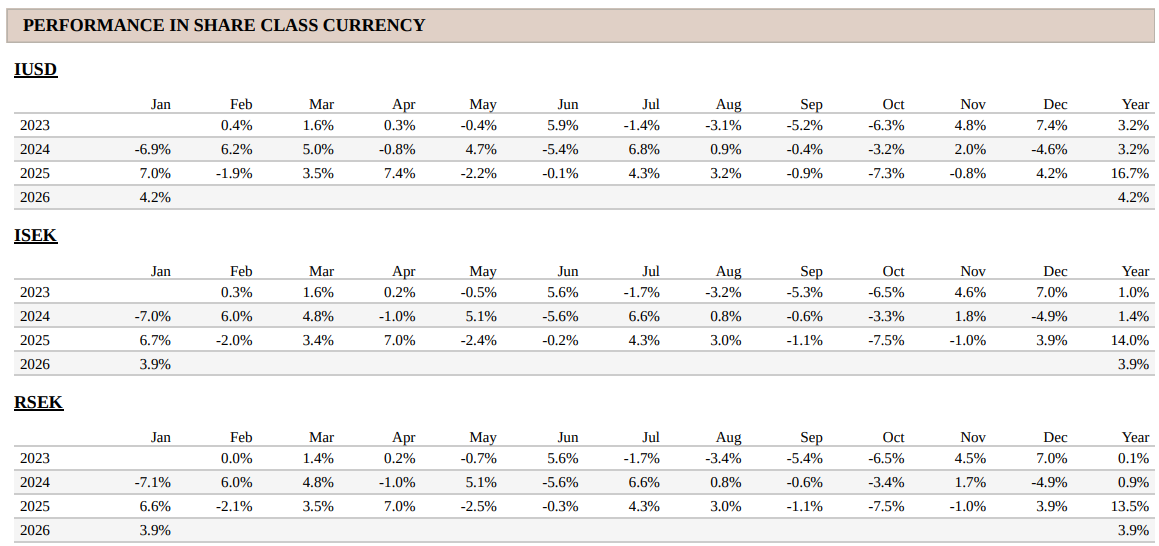
Note that the information below describes the share class (I USD), which is a share class reserved for institutional investors. Investments in other share classes generally have other conditions regarding, among other things, fees, which affects the share class return. The information below regarding returns therefore differs from the returns in other share classes.
Past performance is not a guarantee of future returns. The price of the investment may go up or down and an investor may not get back the amount originally invested.
1) Share Class I USD
Performance for other share classes towards the end of the report.
FUND MANAGER COMMENTARY
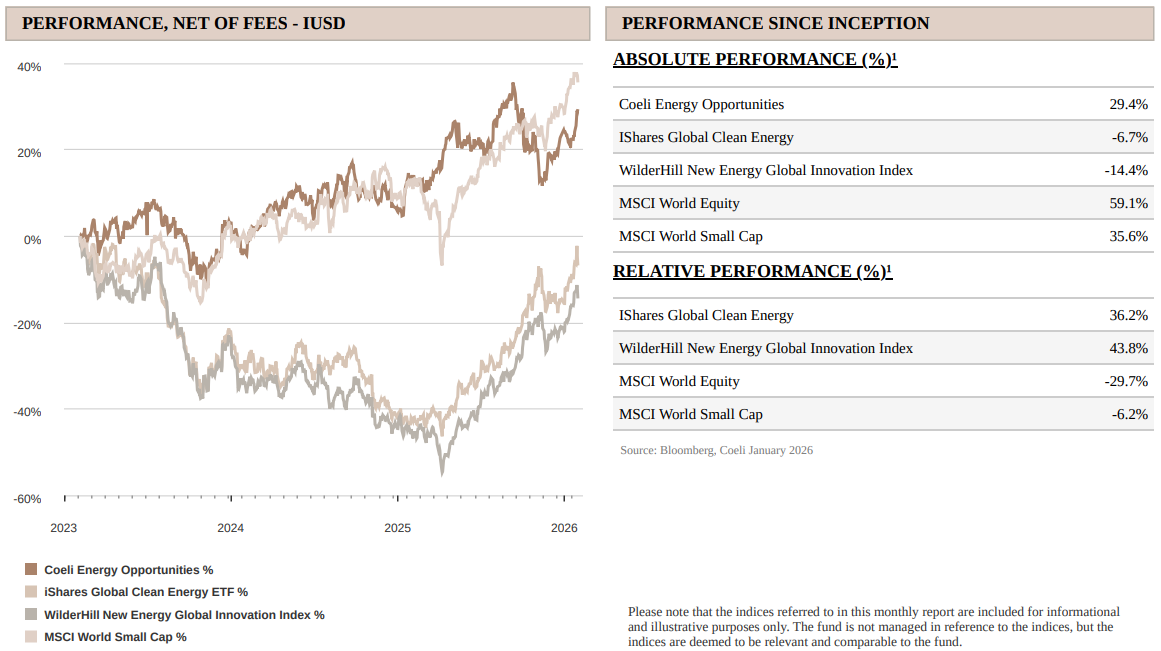
The Coeli Energy Opportunities fund gained 4.2% net of fees and expenses in January (I USD share class). The fund is up 29.4% since inception in February 2023.
In January, the fund underperformed its most comparable indices, the Wilderhill New Energy Global index (NEX) and the iShares Global Clean Energy (ICLN) by 6%. Since inception, the fund remains ahead of NEX and ICLN by 44% and 36%, respectively.
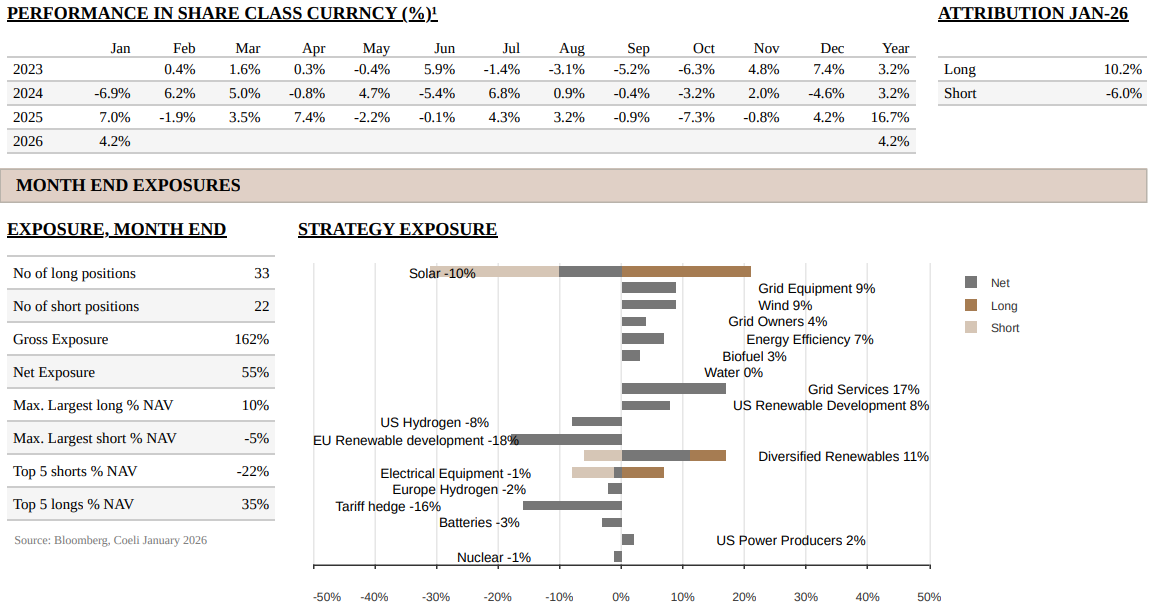
The fund had a good start to the year. Long positions contributed 10.2% to NAV as holdings within the grid infrastructure and ‘powering AI’ thematics continued to perform well. Short positions detracted 6.0%, reflecting the gradual build-up of hedges around AI-related exposures. These hedges express our concern that an AI stock market bubble could deflate, if not burst, as the market’s focus shifts from capex growth to return on AI investments. This cautious stance kept net exposure below 50% for most of the month, only rising on the final day.
Short‑skewed themes such as “Nuclear”, “Batteries” and “Electrical Components” each detracted between 0.8% and 1.1% of NAV. The best‑performing theme was again “Diversified Renewables”, adding +3.0% to NAV, driven by strong performance from Siemens Energy (ENR), Bloom Energy (BE) and Micron Technology (MU). The second‑best‑performing theme was “Wind”, supported by Nordex (NDX1) in particular. At month‑end, the overall net and gross exposures stood at 55% and 162%, respectively.
MARKET COMMENT – ROTATION OUT OF LARGE-CAP TECHNOLOGY
In January, the S&P 500 and Nasdaq rose 1.4% and 1.2%, respectively, recovering from a couple of weak months at the end of 2025. However, the rotation out of the “MAG7” and large-cap technology continued, with the S&P 500 Equal Weight Index (SPW) and the Russel 2000 (RTY) small cap index rising 3.3% and 5.3%, respectively. Over the last 3 months, both SPW and RTY have outperformed the S&P 500 and Nasdaq by 4.0% and 6.5%, respectively.
There are several reasons for large tech’s underperformance. First, uncertainty around both the return on and financing of AI investments is increasing. Moreover, the big theme in January was the sharp sell-off in software companies which accelerated with the release of Anthropics Claude Cowork mid-month. Second, the tech sector has massively outperformed other sectors over recent decades, leaving its valuation rich relative to the broader market. If large technology companies are becoming structurally more capital‑intensive due to massive data centre investments, it is reasonable to question whether the sector should continue to trade on historically high valuation multiples.
Finally, despite geopolitical turbulence with headlines focused on kidnappings in Venezuela, annexation of Greenland and potential strikes on Iran, the near‑term macroeconomic backdrop remains favourable. Fiscal stimulus via tax cuts in the US and German government stimulus in Europe, combined with the prospect of at least two more US rate cuts this year, should support growth. Furthermore, double‑digit earnings growth is expected in the US in 2026, which helps backstop the risk of a major correction and supports a continued “melt‑up” in sectors not negatively impacted by AI‑related uncertainty.
GAS TURBINES - A KEY BOTTLENECK, BUT FOR HOW LONG?
The past few years have reshaped the global gas turbine market in ways few expected. As one of the pillars of global power generation, gas remains, alongside wind and solar, the only technology of meaningful scale still growing worldwide. What began as a steady recovery has become one of the most dramatic backlog extensions the industry has ever seen. Lead times for large turbines stretch into the 2030s, and pricing for the largest machines has increased by close to 300 percent. AI driven load growth, rising baseload requirements in the Middle East and Asia, and Europe’s ongoing need for dispatchable power have created a demand environment that overwhelms supply.
Today, the industry can supply roughly 50-60GW of gas turbines per year, while orders last year approached 88GW. Capacity expansions have been announced but may only take supply to around 100GW by 2030, or 120-125GW if we include aeroderivative turbines, gas engines and fuel cells. These estimates are uncertain, but the conclusion is clear; demand for the largest and most efficient machines cannot be met. As a result, many data centre developers unable to secure large turbines are installing less efficient reciprocating engines or small turbine systems as interim or stop-gap solutions.
A rapid build out is underway in these smaller turbine and engine segments to meet this demand. Anyone with a credible power solution is targeting the data centre market, especially in the US. This contrasts sharply with the market for large H-class turbines (300-400MW and above), where the supplier base is highly concentrated, visibility is better, and undersupply is likely to persist. Both markets cater to the same underlying demand, but they are fundamentally different in terms of product, competitive dynamics and ultimately where pricing power resides.
Understanding where pricing power sits is central to our investment process. We start with our top-down industry analysis, focusing on supply and demand and bottlenecks, before turning to bottom-up company analysis. We believe bottom-up analysis alone is rarely sufficient. Directional demand offers limited insight into cycle turning points within specific product categories unless the supply side is properly understood. This framework underpins our conviction in companies like Siemens Energy (ENR), even after nearly a 300% share price appreciation since our initial purchase.
The turbine market spans a wide spectrum. At one end are the large F and H class machines that in combined-cycle configuration can produce more than 800MW using waste heat via a steam turbine. These sit at the top of the technology stack and are dominated by three companies: Siemens Energy, GE Vernova and Mitsubishi. All three are expanding capacity, but at a measured pace and on increasingly attractive pricing, at least for now.
At the other end is a fast-growing ecosystem of smaller power solutions: small gas turbines, reciprocating engines, fuel cells, aero derivatives, hybrids and mobile generator sets. These are increasingly deployed “behind the meter” (BTM) by data centres waiting for grid connections, a topic we discussed in our October 2025 report “Bring your own power, how the data centre is rewiring the grid”. In this segment, barriers to entry are lower, engineering cycles shorter and systems modular enough to scale quickly.
Some examples, but the list is far from exhaustive:
- Bloom Energy (BE), the global leader in fuel cells, is expanding manufacturing capacity to at least 2GW per year and positioning its technology directly against smaller turbines and engines, with the added benefit of higher efficiency and direct current output, which reduces the need for expensive transformers in future data centre architectures. Technology and scale create high barriers to entry versus new fuel cell competitors.
- FTAI Aviation (FTAI), an aerospace company specialising in jet engine repair and leasing is repurposing existing CFM56 aircraft engines into 25MW aeroderivative units. It is targeting an expansion to around 100 units per year, equivalent to 2.5GW of annual supply in a few years.
- Boom Supersonic, an engine maker for supersonic flight, is emerging with a containerized 42MW aeroderivative units and already received their first order for 29 units worth USD 1.25bn.
- Baker Hughes (BKR), the oil service giant, is already an established player in this aeroderivative market, partly through its JV with GE Vernova.
- Caterpillar (CAT), a major industrial gas turbine producer, plans to increase its turbine manufacturing capacity by roughly 2.5 times by 2030, with combined turbine and engine capacity expected to reach around 50GW of annual supply.
- Wärtsilä (WRT1V), a large engine manufacturer, is increasing capacity by around 35 percent.
- Some other notable participants that are also actively targeting data centres and have aggressive capacity expansion plans are: Cummins, Rolls-Royce, Kawasaki Heavy Industries and Man Energy.
Taken together, this ecosystem is becoming crowded, with existing players and new entrants all scaling aggressively to target the same BTM data centre market.
Can demand absorb all this supply?
Estimates for installed US data centre demand in 2030 vary widely from around 75GW (BNEF) to 130GW (BCG), up from roughly 45GW of installed capacity today. The more conservative estimates focus on interconnection queues and assume BTM solutions will remain a niche, given the complexity and cost of operating a parallel power system 24/7. We recognise these challenges, but given hyperscalers’ substantial capex commitments and the high value they place on time to power, we find it likely that BTM solutions will play a role, at least as interim capacity until large gas turbines and grid connections are available. We therefore run different scenarios for the share of new data centres going BTM and track developments closely, as this has important implications for the evolving supply picture.
For illustration, assume 15GW of BTM data centre capacity is added by 2030. Including 30% redundancy, this implies a total addressable market for smaller turbines, engines and fuel cells of roughly 4GW per year. Bloom Energy (BE) alone could soon cover half of that, or more. Even if we double our BTM demand estimate, the capacity additions outlined above suggest that supply is likely to overwhelm demand for smaller power units, whether they are turbine or engines, by 2030.
It remains unclear whether these smaller solutions will become permanent power sources or primarily serve as stop gap measures until grid connections are secured. Our base case is that grid connection remains the preferred option wherever possible, which makes us cautious about taking too much exposure to this segment of the “Powering AI” market.
Instead, we prefer Siemens Energy (ENR) and its larger turbines, which are essential for grid build-out. The end markets are more diversified, in fact in 2025, only about 20-25% of large turbine orders were related to data centers. With three players controlling an estimated 80-90% of this market, we foresee a longer-than-normal cycle for this highly profitable sub-segment of the gas turbine industry. We also like EPCs such as Mastec (MTZ), which should benefit from both grid expansion and from connecting BTM data centres to the gas network.
In our September-2025 report, “Are we in an AI bubble”, we wrote that “overbuilt infrastructure is historically rather a feature, not a bug of transformative infrastructure spending cycles.” Timing such a bubble is incredibly difficult but understanding the underlying cycles is less so. That is why our investment process begins where it does; with understanding the cycle, the bottlenecks and the industry structure. This philosophy has guided our strategy for more than a decade. While we still prefer exposure to the larger turbines and believe this cycle has further to run, we are acutely aware that conditions in cyclical industries can change quickly, and we are continuously monitoring this dynamic.
FUND PERFORMANCE - BURIFICATION IN THE AI WORLD
January’s performance was solid, with 10 out of 18 themes generating a profit. ‘Powering AI’‑related themes continued to perform particularly well: “Diversified Renewables” contributed +3.0% to NAV, while “Grid Services” and “Grid Equipment” added a combined +1.9%.
After an extended rally we fortunately exited our position in Bloom Energy (BE) after a 93% year‑to‑date rally. Concerned about potential spillover from the sell‑off in software and uncertainty ahead of BE’s Q4 report, we chose to take profits and reassess after earnings. This adjustment, combined with active trading in a high volatile environment, boosted the P&L in late January and into February. We have since re‑established part of the position in BE post Q4 earnings.
In “Grid Services”, Mastec (MTZ) rose 11% on growing optimism around strong order intake and improving margins. MTZ is a top three position for the fund.
In “Grid Equipment”, all holdings contributed positively, but Prysmian (PRY) accounted for the lion’s share, gaining 16% in January and breaking out to the upside of its recent trading range. We also participated in an IPO in ASTA Energy Solutions (1AST), a small manufacturer of specialized copper components for power transformers and generators. It is an exciting company with Siemens Energy (ENR) as both its largest customer and a major shareholder.
Another strong theme was “Wind”, driven by continued excellent performance from Nordex (NDX1). The company reported another solid quarter of order intake in Q4 and ended 2025 with 10.2 GW of orders, 22% higher than in 2024, its previous record year. The stock is up 200% since the end of 2024 and was the largest contributor to fund P&L last year. We have trimmed the position somewhat but remain optimistic and expect earnings upgrades following the announcement of a new EBITDA margin target.
The ‘Solar’ theme contributed 0.7% to NAV but had a very mixed performance. The big positive contribution came from Nextpower (NXT) which rose 34% after very strong fourth quarter results. The large negative was First Solar (FSLR), the fund’s largest long position, which fell 14% in January on a triple whammy of concern on quality issues, weak order intake and potential competition from Tesla.
First, FSLR disclosed quality issues on its Series 7 modules in 2024 and declared a warranty provision of up to USD 100m. Management has stated that the manufacturing error was fully corrected in October 2025, but it will take several quarters of field performance to confirm that the issue has been fully resolved. In the meantime, there is uncertainty over whether, and by how much, the warranty provision might be increased. This has weighed on the shares but is clearly not the main reason for the sharp value decline of USD 7bn (down 23%) over the last six weeks.
Second, the market fears that FSLR will report weak order intake for the last quarter. We disagree. We expect order intake to be limited because it makes little sense to sell 2028+ volumes just months, perhaps weeks, before Section 232 tariffs on polysilicon are announced. As we have previously described, these tariffs are intended to make US polysilicon production viable and to reduce reliance on Chinese‑controlled polysilicon. We expect the tariffs to be phased in gradually, with initial carve‑outs for European producers, but by 2028/29 the tariff could be at least USD 0.05/W. With FSLR’s 17.7GW of domestic capacity, this could represent around USD 900m of incremental annual revenue and profit. On a 12–15x P/E, this equates to USD 100–125 per share of potential value. At the end of January, the stock was trading at USD 225 per share.
Third, towards the end of the month, Elon Musk announced that as part of his ambition to put data centres into space, he intends to build 100 GW of US solar manufacturing capacity, from raw materials through to finished panels. This caused the FSLR share price to take another leg down. Although details are scarce, Musk did confirm that Tesla has not allocated any capex to this initiative in 2026.
We believe the market is overreacting to this perceived threat:
- US utility‑scale solar demand this year is around 40 GW. A 100 GW manufacturing base would only be needed if solar demand were to explode, as Musk anticipates due to AI‑driven power demand. This would likely be good news for FSLR.
- Building 100 GW of capacity in the US would probably cost more than USD 55bn, and unless Tesla/SpaceX plan to use all the capacity inhouse, the resulting capacity would almost certainly be uncompetitive versus Chinese producers in global markets (by a factor of ~3x on cost) and 15–30% more expensive than FSLR in the domestic market.
- It takes at least two years to bring new metallurgical‑grade silicon mines online, and an additional 3–4 years to scale polysilicon and wafer capacity. This timing means any new capacity would likely miss out on the significant manufacturing tax credits, which are set to phase out from 2030.
- It is unclear which PV technology Musk envisions. If it is crystalline silicon TopCon modules, FSLR owns some of the relevant US patents and could potentially earn a royalty of around USD 0.05/W. At 100 GW of capacity, that would equate to roughly USD 5bn in annual income, or around USD 40 per share for FSLR.
- Finally, it is unclear how much of the 100 GW would be intended for Earth‑based projects versus orbital data centres. Musk has suggested that within 30–36 months, the most economically compelling place to build AI will be in space.
All in all, if it proves technically and economically viable to build data centres in space, it is very likely that Musk and his companies will play a major role. However, given the complexity and weight of data centre hardware, and the fact that power accounts for only about 10% of the total cost, it seems unlikely that building in space would offer overall cost advantages, despite the ideal conditions for solar power generation. Moreover, we note that Musk has an intention to list SpaceX sometime this year; framing space‑based data centres as a vast future market naturally supports a higher perceived franchise value if investors buy into a scenario of rockets taking off every three minutes.
Like Musk, we are optimistic about AI’s impact on global productivity and believe it will be transformative for society. However, as we explained in our September 2025 monthly, “Are We in an AI Bubble?”, we are uncertain about how easily the enormous investment will be monetised and whether returns will accrue broadly to investors or be socialised, as in many past investment booms. Time will tell, but we have increased our AI‑related hedges in recent months.
In January, these hedges had a negative impact on P&L. The three largest losing themes, “Nuclear”, “Batteries” and “Electrical Equipment”, were all skewed short AI‑related names and together detracted 3.0% of NAV. We will, however, continue to prepare for increased volatility and bifurcation between winners and losers in the ‘Powering AI’ universe.
As we warned in the November 2025 report, we believe the market has shifted its focus from “ever‑increasing AI investments” that lift all share prices, towards identifying early losers and questioning the return on AI investments. This is evident in the fact that hyperscalers have underperformed the market for three consecutive months, and the software sector has just recorded its worst relative performance since the Global Financial Crisis.
Yet the hyperscalers are not slowing AI investments, at least not yet. At the start of the year, the four largest players, Alphabet, Microsoft, Amazon and Meta, were expected to increase AI‑related capex by around 30% in 2026. Five weeks into the year, the latest company guidance points to a 60–70% increase, following large upgrades from Alphabet, Amazon and Meta; only Microsoft has maintained its budget from last year. The scale is staggering: these four companies alone are set to invest more than 2% of US GDP this year, and the incremental capex above expectations a month ago exceeds USD 100bn. For comparison, the tax cuts in the One Big Beautiful Bill Act amount to less than 1% of US GDP.
AI investments are already hugely impactful for the real economy and the stock market, especially for our universe of power and infrastructure providers. However, it is notable that three of the four hyperscalers sold off sharply after their Q4 results. If higher capex is no longer rewarded by the market, at least when not accompanied by AI revenue growth exceeding expectations, we may be getting closer to peak spending.
Nevertheless, until we see clearer signs of a change in investment behaviour, we will maintain our high‑conviction long positions in power and infrastructure companies with durable competitive advantages, while continuing to identify and add hedges and short positions to prepare for the next leg of this trade.
Thank you for your continued trust and confidence. We look forward to updating you again next month.
Sincerely
Vidar Kalvoy & Joel Etzler
Past performance is not a guarantee of future returns. The price of the investment may go up or down and an investor may not get back the amount originally invested.

- Portfolio Manager and Founder of the Coeli Energy Opportunities Fund.
- Over 15 years of investment experience spanning both public markets and private equity.
- Managed the Coeli Energy Transition Fund from 2019 to 2023.
- Spent six years at Horizon Asset in London, a market-neutral hedge fund.
- Started working with Vidar Kalvoy in 2012.
- Five years in Private Equity at Morgan Stanley.
- Began his investment career in the technology sector at Swedbank Robur in Stockholm in 2006.
- Holds an MSc in Engineering from the Royal Institute of Technology (KTH), Stockholm.
- Portfolio Manager and Founder of the Coeli Energy Opportunities Fund.
- Has managed energy equities since 2006 and brings more than 20 years of experience in portfolio management and equity research.
- Managed the Coeli Energy Transition Fund from 2019 to 2023.
- Head of Energy Investments at Horizon Asset in London for nine years, a market-neutral hedge fund.
- Experience from energy investments at MKM Longboat in London and equity research in the technology sector in Frankfurt and Oslo.
- Holds an MBA from IESE in Barcelona and a Master’s in Business and Economics from the Norwegian School of Economics (NHH).
- Before entering finance, he served as a lieutenant in the Royal Norwegian Navy.
IMPORTANT INFORMATION. This is a marketing communication.
Before making any final investment decisions, please refer to the prospectus of Coeli SICAV II, its Annual Report, and the KID of the relevant Sub-Fund. Relevant information documents are available in English at coeli.com. A summary of investor rights will be available at https://coeli.com/financial-and-legal-information/.
Past performance is not a guarantee of future returns. The price of the investment may go up or down and an investor may not get back the amount originally invested.
Please note that the management company of the fund may decide to terminate the arrangements made for the marketing of the fund in one or multiple jurisdictions in which there exists arrangements for marketing.