This material is marketing communication.
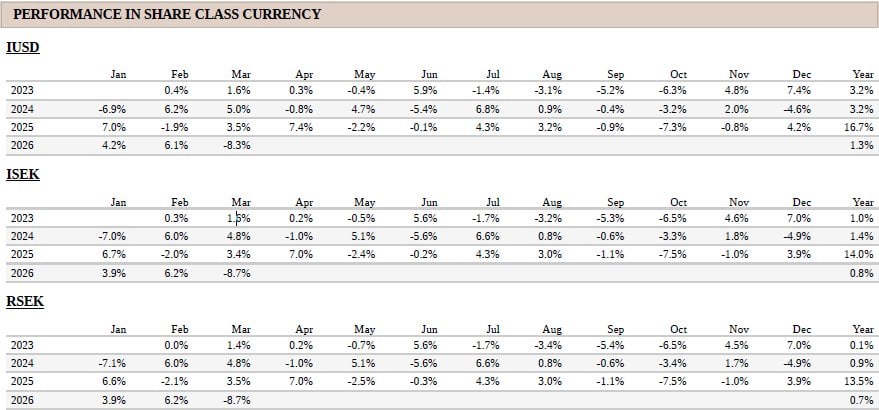
Note that the information below describes the share class (I USD), which is a share class reserved for institutional investors. Investments in other share classes generally have other conditions regarding, among other things, fees, which affects the share class return. The information below regarding returns therefore differs from the returns in other share classes.
Past performance is not a guarantee of future returns. The price of the investment may go up or down and an investor may not get back the amount originally invested.
1) Share Class I USD
Performance for other share classes towards the end of the report.
FUND MANAGER COMMENTARY
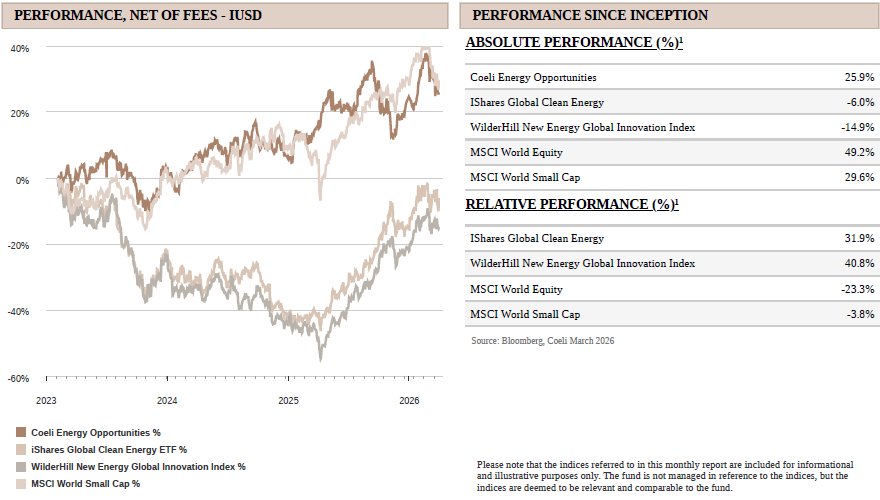
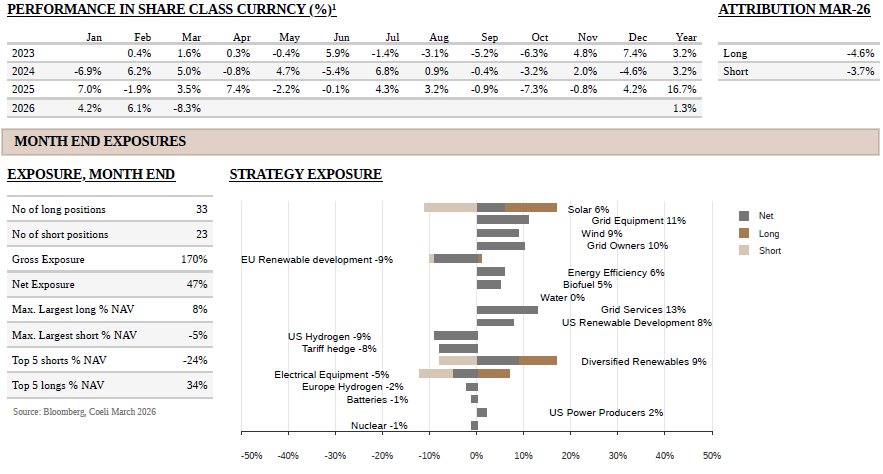
The Coeli Energy Opportunities fund lost 8.3% net of fees and expenses in March (I USD share class). Year-to-date, the fund is up 1.3% and it has gained 25.9% since inception in February 2023.
In March, the fund underperformed its most comparable indices, the Wilderhill New Energy Global index (NEX) and the iShares Global Clean Energy (ICLN) by 3.5% and 8.7%, respectively. Year to date, the fund has lagged NEX by 8% and ICLN by 10%, while since inception it remains ahead by 41% and 31%, respectively.
March was a brutal month in many ways. The Iran war overshadowed everything else and, as we wrote last month, we initially expected the conflict to last only a few weeks, assuming President Trump would prioritise his own survival in the mid‑terms later this year. However, it takes two to tango, and as it became clear that Iran had increased its leverage through de‑facto control of the Strait of Hormuz, the war dragged on until a fragile ceasefire was reached this week.
After a strong start to the year, our book was not positioned for a prolonged war going into March. Although we quickly shifted more net exposure from Europe to the US, our European AI‑linked long themes still took a significant hit. Roughly 75% of the drawdown in March stemmed from European positions, led by Siemens Energy (ENR) and Schneider Electric (SU), which dragged down their respective themes, “Diversified Energy” and “Electrical Equipment”, deducting 1.8% and 1.3% of NAV, respectively. The fact that AI related shorts in the US only declined modestly exacerbated the losses. “US Renewable Development” was the third‑worst‑performing theme, detracting 0.9% solely because AES was taken out at a discount to its February closing price, a rare event and an unfortunate one in an already difficult month. We discuss this and other drivers in more detail in the fund‑performance section.
Only 25% of the themes generated positive returns in March, led by “Biofuels”, a small theme with two long positions that benefitted from higher fuel margins and some political tailwind in the US. Short‑skewed themes in “Nuclear” and “Batteries” also posted small gains. At month‑end, overall net and gross exposures stood at 47% and 170%, respectively.
MARKET COMMENT – AN ENERGY CRISIS AVERTED
In March, both the S&P 500 and Nasdaq 100 declined by about 5%, while the S&P 500 Equal Weight Index and the Russell 2000 fell 6.2% and 5.1%, respectively, in a broad‑based sell‑off driven by the Iran war. Whereas February saw record dispersion between winners and losers against a relatively calm index backdrop, March was the third‑worst month on record for dispersion, with Iran‑war headlines driving high volatility and strong cross‑asset correlations. It was not an easy market in which to maintain an edge.
Europe’s Stoxx 600 declined by 8%, reflecting Europe’s greater exposure to the conflict via its dependence on natural gas, whose prices had risen almost 60% by month‑end. Even so, this is far from 2022, when Russia’s invasion of Ukraine pushed European gas prices up almost 200% in weeks and the Stoxx 600 fell double digits. One key difference is that relatively little European LNG is imported from Qatar, so the brunt of the pain this time has, so far, fallen on Asian consumers. Moreover, both Europe and Asia are less gas‑dependent today as solar and wind account for roughly 30% of the EU’s generation mix versus 19% in 2022, and both regions, especially Asia, have ample coal capacity that is being ramped up to displace expensive gas‑fired power.
Another difference is expectations. In 2022, markets anticipated that Europe would sharply curtail purchases of Russian pipeline gas, effectively shutting in supply. This time, markets generally expect Qatari LNG to resume later this year. Forward gas prices reflect this as end‑2027 contracts are only about 10% above pre‑war levels, and end‑2028 prices are essentially unchanged. While Qatar accounts for roughly 20% of global LNG capacity, LNG itself represents only about 13–15% of total global gas demand. This means that even if Qatar’s LNG production is shut in for a full year, the world would lose only around 2.5–3% of total gas supply, less than the total reduction in Russian pipeline flows to Europe in 2022. On the gas side, 2022 was clearly the more severe energy crisis.
The situation is different in oil. The Strait of Hormuz carries roughly 20% of global oil supply, and the key reasons oil prices have not spiked far higher are that the market was oversupplied going into the war with record stocks, rapid releases from strategic reserves, spare pipeline capacity across the Arabian Peninsula, and likely continued Iranian exports to China through the month. Still, as we noted in our February report, even a sustained reduction to 70% of normal Hormuz volumes would remove 3–4% of global oil supply, necessitating demand destruction to rebalance the market. If the current ceasefire were to fail, bombing resumed and Gulf energy infrastructure (in Iran or GCC states) suffered major damage, the shortage could become more persistent. This risk has decreased somewhat with the two‑week ceasefire, but it is still more than a mere tail risk.
The two-week ceasefire has had a rocky start. Divergent Farsi and English versions of the proposed 10‑point framework highlight fundamental disagreements over uranium enrichment, regional military presence and control of the Strait of Hormuz. The inclusion of Israel’s long‑running conflict with Hezbollah in Lebanon further complicates the picture. We therefore see limited odds of a quick, comprehensive peace agreement. The best realistic outcome is likely an extension of the ceasefire and prolonged negotiations ending in a “non‑agreement status quo” that stops active fighting and gradually reopens the Strait. For equity markets, the reopening of Hormuz is the critical variable. Difficult issues such as nuclear constraints, regional military basing and sanctions architecture would likely be deferred or fudged, but the US would be able to quietly end hostilities, providing the off‑ramp President Trump, and the stock market, desperately crave. Although this leaves the oil and gas markets with higher risk premiums, the world economy is significantly less energy intensive than in the past and an oil price closer to USD 100 per barrel is historically just slightly above the 20-year average inflation adjusted oil price of USD 93-94.
Looking beyond the war, the set‑up for the rest of the year is mixed. On the positive side, the underlying economy, driven in part by AI‑related spending, remains strong. Fiscal stimulus from the OBBBA tax cuts is filtering through, and first‑quarter earnings are still expected to grow at a double‑digit rate year over year. According to Goldman Sachs, aggregate EPS revisions have risen by about 3% since the war began.
On the negative side, several headwinds are building. The fiscal impulse from OBBBA turns negative in the second half, concerns around private credit are still playing out, and the pre‑war expectation of multiple rate cuts has been replaced by rate hikes in Europe and no cuts in the US. Forecasts for 2026 GDP growth in both the US and Europe have been revised lower as higher energy costs and tighter financial conditions start to bite. While consensus earnings estimates have not yet moved meaningfully, we would expect the impact of the Iran war to show up in revisions over the coming months.
Finally, AI investments have been a major growth driver in recent years, but the question now is whether the war‑related shocks we describe in the thematic section could slow hyperscaler data‑centre spending, or whether, despite higher costs and more complexity, the AI capex cycle will continue to accelerate?
CAN THE IRAN WAR DERAIL THE AI TRADE?
The question is not whether the Iran war is negative for the AI trade. Clearly it is. The more relevant question is whether it changes the direction of travel, or simply raises the cost, complexity and selectivity of the build‑out. AI infrastructure is a long and highly interdependent supply chain. It starts with power, fuel and financing, runs through chips, memory, cables, racks, transformers, switchgear and cooling systems, and ends with the data centres themselves. A disruption in the Gulf does not need to halt GPU shipments outright to matter, it only has to tighten a few already fragile links.
Power prices and the cost of running AI
One obvious concern is energy. Data centres are power‑intensive assets, and many electricity markets still clear off gas at the margin. As explained above, even if the Strait of Hormuz could fully reopen within months, global energy markets will embed a higher risk premium in oil and gas prices going forward. That is clearly negative for operators and developers of data centres, particularly in Europe and Asia, which are more exposed to global gas prices.
The counterarguments are that most existing and planned capacity sits in the US, where natural gas prices are down since the outbreak of the war, and that hyperscalers are so profitable that even a substantial increase in power prices is unlikely to alter their build‑out plans. A more realistic risk is that if elevated power prices persist, especially outside the US, regulators and utilities impose stricter additionality and “bring-your-own-power” requirements, complicating grid access and adding to project complexity.
Chip supply and the helium constraint
The more serious risk is physical rather than financial. Semiconductors remain the most valuable and constrained component of the AI stack, not only GPUs from Nvidia (NVDA) but also high‑bandwidth memory from suppliers such as Micron (MU) and SK Hynix. These markets were already supply‑constrained before the war, with backlogs stretching well into next year.
Higher energy costs are clearly unwelcome for energy‑intensive industries, but with customers desperate for compute, much of the incremental cost can likely be passed through. That alone is unlikely to stop the AI build‑out. The bigger concern lies in inputs that could physically limit production.
Helium is the most important of these. It is essential for cooling, plasma etching and EUV lithography, and there is no viable substitute in advanced semiconductor manufacturing. Helium is a by‑product of gas processing, and Qatar accounts for more than a third of global supply. Its production has been offline since early March following Iranian drone strikes, and even with a partial reopening of Hormuz under the ceasefire negotiations, it remains unclear when LNG and helium production can restart.
South Korea and Taiwan, which dominate advanced semiconductor manufacturing, source a large share of their helium from Qatar and have already triggered mitigation measures, including helium recycling on selected lines that could reduce demand by 15-20% if fully implemented. In the meantime, buffer stocks estimated at three to six months are being drawn down. While helium represents less than 0.5% of chip production costs, the spot market is extremely thin as most volumes are sold under long‑term contracts. If supply is not restored by late‑summer, declining inventories risk becoming a binding constraint on AI chip output.
That said, it is worth maintaining perspective. Semiconductor manufacturing makes up about 25% of global helium demand and the industry’s ability to absorb cost increases in the current AI driven boom will price out any other users. Industrial welding, for example, accounts for about 8% of US helium demand, but since helium can be substituted with argon, we would expect long term contracts in such segments to be resold at a premium to the semiconductor customers. If not, government are likely to intervene and reallocate volumes to the economically and strategically critical semiconductor industry.
Financing risk, private credit and Gulf capital
Financing is another transmission channel. Historically, sustained energy shocks, even if supply driven, have tightened financial conditions as central banks raise rates to contain inflation. Given that data centre development is very capital intensive, higher rates increase total construction costs and can eventually weigh on demand. For now, the picture remains mixed as the ECB is expected to tighten further, while the Fed has signalled that near term hikes are unlikely.
Even without additional rate increases, financial conditions have tightened since the war began. While hyperscalers are largely internally financed and can absorb higher capital costs, smaller data-centre developers, neo clouds, power project SPVs and many AI related start ups all rely on external capital and may struggle to raise funds on attractive terms. Key equipment suppliers, themselves a bottleneck in the AI build out, may also hesitate to pursue aggressive capacity expansion if their own funding costs rise. Still, it is important to remember that the rate-insensitive hyperscalers account for the majority of AI capex.
Concerns around private credit have added another layer of uncertainty. Several funds gated redemptions earlier this year, raising fears about the availability of non bank capital. That risk is real, but it matters how it is framed. Blue Owl, which sat at the centre of the debate, reportedly sold assets at close to 99.7 percent of par within a week of the gating, while restrictions imposed by banks such as JP Morgan, which made headline news, relate to lending against private credit funds seeking leverage, rather than to end projects themselves. This is more analogous to adjusting repo haircuts than to a withdrawal of capital. Most capital in private credit vehicles is unlevered, ‘real money’ funding; while defaults in software or AI companies will reduce returns for savers, the risk looks manageable rather than systematic in the near to medium term.
Gulf capital is another area of focus. Sovereign wealth funds from the region have been important partners in data centre and AI projects. Their ability to deploy abroad could be constrained if capital is needed domestically to rebuild infrastructure or offset lost energy revenues. That risk exists, but for now capital availability is seemingly ample. For example, OpenAI’s latest funding round reportedly closed at around USD 122bn raised at a post-money valuation in the USD 850bn range, which hardly points to a market starved of capital, at least not yet.
Policy risk
Policy risk was rising even before the war. Political resistance to data centre power consumption has been building as grid constraints become more visible. Although US power prices have not been impacted by the Iran war, the gasoline price has risen nearly 40% since before the conflict. This could make consumers even more hostile towards future data centres as their costs are squeezed from several directions. Stricter rules around grid access, demand response, emissions, local content and “bring your own power” requirements appear increasingly likely. This will lengthen timelines, raise capex and shift risk away from smaller, less well capitalised developers.
Conclusion
We do not currently see the Iran war as a direct showstopper for the “Powering AI” theme, provided two conditions are met: 1) helium production in Qatar restarts by late-summer, and 2) oil and gas flows through Hormuz normalise sufficiently to avoid a sustained energy price shock that forces broad demand destruction.
Even under those assumptions, AI infrastructure is likely to become more expensive, more regulated and more geographically selective. Higher energy costs, tighter credit and greater physical and political risk will raise the cost of capital and tilt the playing field in favour of large, well capitalised hyperscalers over smaller neo clouds. On-site and behind the meter power and grid upgrades are likely to gain share versus marginal developments, while companies that can pass through costs and manage complexity will be preferred over those reliant on cheap funding and benign policy.
Crucially, demand for compute still appears to be growing faster than supply, and hyperscaler capex intentions remain intact. In our view, this points to an AI investment cycle that is more likely to be inflationary than derailed. Cost inflation is nothing new for the hyperscalers, which have been dealing with rising power and infrastructure costs for years. If anything, the additional inflationary pressure from the Iran war may push total capex higher, as more is spent to secure power, chips and resilient infrastructure. The direction of travel of more power, more capacity and more grid is likely to continue, and rather accelerate in regions like Europe and Asia because of this conflict. For now, we view the AI trade as dented but far from derailed.
FUND PERFORMANCE - TRADING AN ENERGY WAR
March was a difficult month for the fund. We misjudged the duration of the war, assuming President Trump would move quickly to declare victory and that, even if oil and gas prices stayed above pre‑war levels, an equity rally would follow. We were wrong on the timing, but our concern about a powerful squeeze was well founded. Instead of a flimsy victory announcement in mid‑March, we got a fragile ceasefire in early April that triggered a sharp risk‑on move. Despite having been stopped out of some positions, the fund has so far in April recovered around 65% of March’s drawdown.
The worst‑performing themes were related to the AI thematic, led by European names, while US peers generally outperformed the market. “Diversified Renewables” and “Electrical Equipment” were the two weakest themes due to the European exposure, whereas “Grid Services” finished roughly flat as losses in SPIE, a European EPC, were offset by continued strong performance in US EPC Mastec (MTZ), now up 48% year to date. While we understand the knee‑jerk selling of European cyclicals as energy prices rise and recession fears pick up, we believe the services of companies like Siemens Energy (ENR), Schneider Electric (SU) and SPIE will be in greater demand as Europe refocuses on energy security and independence.
The third‑worst performing theme was “US Renewable Development”, which detracted 0.9% from NAV when AES, a renewable developer and utility, was taken out at USD 15 per share after having rallied above USD 17 on the last day of February. While the PE buyer argued the deal came at a premium to the undisturbed price, we were disappointed as we saw fair value closer to USD 20. Over a 30‑year career we have lost money many times being short stocks that were acquired, but this is the first time we have meaningfully lost money being long a take‑out target.
Another weak theme was “EU Renewable Development”, where our shorts in power generators worked against us as the war lasted longer than expected. As we discussed last month, we still believe many of these companies are overvalued as they have hedged most of their near‑term production and forward curves have barely moved. Even if further Gulf infrastructure damage were to lift European power curves into the 2030s, we expect policymakers to swiftly re‑introduce windfall taxes, as they did in 2022. Nonetheless, these shorts, together with short positions in some solar and wind names that squeezed on fears of a 2022‑style energy shock, meant the overall short book detracted 3.7% in March.
There were few bright spots in March. The best‑performing theme was “Biofuels”, a relatively small bucket with two US long positions that benefit from higher diesel prices. The largest, Darling Ingredients (DAR), has also enjoyed improving fundamentals and policy tailwinds, with earnings momentum over recent quarters and expectations of higher subsidies and tighter rules on imported feedstocks. The “Nuclear” and “Batteries” themes, both skewed short, also made small gains as overhyped concept stocks became less attractive in a risk‑off tape.
Although March was a challenging month for both the fund and broader markets, April has started on a stronger footing following the ceasefire announcement. We are not especially optimistic about a lasting peace agreement in the Middle East, but our base case is some form of “fudged” arrangement that ends active hostilities and allows Hormuz to reopen, with or without Iranian tolling. From the market’s perspective, what matters most is that energy flows resume. A higher but stable risk premium in oil and gas is something the global economy can absorb, at least for now.
Looking further ahead, we believe the Iran war will only reinforce the focus on energy security and independence. That implies more renewables, more electrification and a larger, stronger grid. Combined with our still constructive view on AI‑driven demand, where appetite for compute continues to outgrow supply, we remain optimistic about our long positions in power and infrastructure companies. At the same time, we will continue to build and adjust hedges and short positions to manage downside risk and prepare for the next leg of this trade.
Thank you for your continued trust and confidence. We look forward to updating you again next month.
Sincerely
Vidar Kalvoy & Joel Etzler
Past performance is not a guarantee of future returns. The price of the investment may go up or down and an investor may not get back the amount originally invested.

- Portfolio Manager and Founder of the Coeli Energy Opportunities Fund.
- Over 15 years of investment experience spanning both public markets and private equity.
- Managed the Coeli Energy Transition Fund from 2019 to 2023.
- Spent six years at Horizon Asset in London, a market-neutral hedge fund.
- Started working with Vidar Kalvoy in 2012.
- Five years in Private Equity at Morgan Stanley.
- Began his investment career in the technology sector at Swedbank Robur in Stockholm in 2006.
- Holds an MSc in Engineering from the Royal Institute of Technology (KTH), Stockholm.
- Portfolio Manager and Founder of the Coeli Energy Opportunities Fund.
- Has managed energy equities since 2006 and brings more than 20 years of experience in portfolio management and equity research.
- Managed the Coeli Energy Transition Fund from 2019 to 2023.
- Head of Energy Investments at Horizon Asset in London for nine years, a market-neutral hedge fund.
- Experience from energy investments at MKM Longboat in London and equity research in the technology sector in Frankfurt and Oslo.
- Holds an MBA from IESE in Barcelona and a Master’s in Business and Economics from the Norwegian School of Economics (NHH).
- Before entering finance, he served as a lieutenant in the Royal Norwegian Navy.
IMPORTANT INFORMATION. This is a marketing communication.
Before making any final investment decisions, please refer to the prospectus of Coeli SICAV II, its Annual Report, and the KID of the relevant Sub-Fund. Relevant information documents are available in English at coeli.com. A summary of investor rights will be available at https://coeli.com/financial-and-legal-information/.
Past performance is not a guarantee of future returns. The price of the investment may go up or down and an investor may not get back the amount originally invested.
Please note that the management company of the fund may decide to terminate the arrangements made for the marketing of the fund in one or multiple jurisdictions in which there exists arrangements for marketing.