This material is marketing communication.
Note that the information below describes the share class (I SEK), which is a share class reserved for institutional investors. Investments in other share classes generally have other conditions regarding, among other things, fees, which affects the share class’ return. The information below regarding returns therefore differs from the returns in other share classes.
Before making any final investment decisions, please read the prospectus, its Annual Report, and the KID of the relevant Sub-Fund here.
SEPTEMBER PERFORMANCE
The fund’s value decreased by 1.5% in September (share class I SEK), while the benchmark increased by 0.2%. Since the change of the fund’s strategy at the beginning of September 2023, the fund’s value has increased by 24.4% compared to an increase of the benchmark by 21.4%.
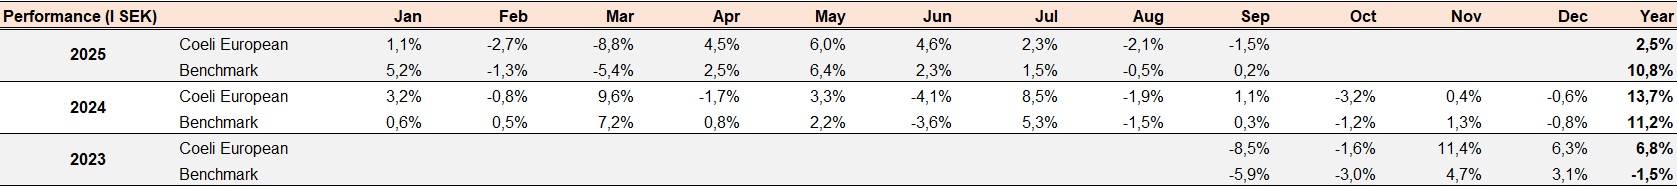
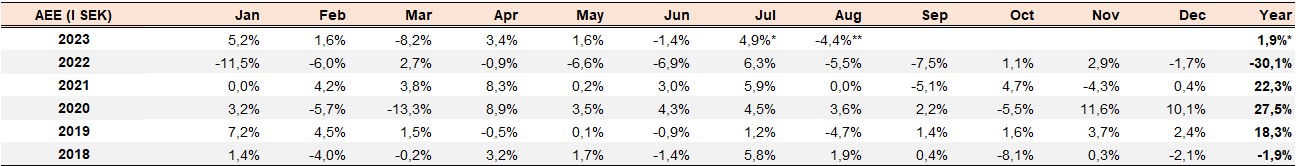
Source: Coeli European
* Adjusted for spin-off of Rejuveron
** Includes September 1 (strategy change to long-only implemented September 4 2023)
Past performance is not a guarantee of future returns. The price of the investment may go up or down and an investor may not get back the amount originally invested.
EQUITY MARKETS / MACRO ENVIRONMENT
The broad European index rose by 1.5% in September compared to the S&P500 which rose by 3.2% (2.7% measured in euros). The performance of smaller companies was, just like in August, weaker. The MSCI SMID closed September basically unchanged while, for example, the Carnegie small-cap index fell by 2%.
The fund posted a weak performance of -1.5% in September. In the absence of any major news flow, it was our cyclical companies Hiab, Kalmar and Traton that collectively accounted for 1.7% of the month's negative results. The strongest contributors were Babcock, SLP and Asmodee, with Babcock rising by a whopping 31%. More about that in the company comments. In September, the fund sold its last shares in Euronext after a phenomenal price development since our first investment two years ago.
Below is the development for various indices this year. The penultimate column on the right shows the development in local currency and the one farthest to the right in SEK. Adjusted for a collapsed dollar and British pound, the development is less impressive. Measured in SEK, for example, the S&P500 has fallen 4%. In addition, and as a point of reference, the Carnegie Small Cap Index has fallen 1% during the same period. To understand the global stock market, it is now crucially important to adjust for FX. USD and GBP have fallen 15 and 9% respectively against the Swedish krona this year. These are very large movements.
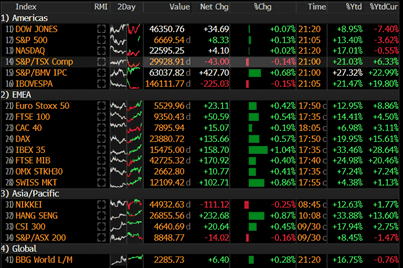
Source: Bloomberg
In addition to the high volatility in the currency market, there is an extreme spread in returns for smaller companies between different geographies this year. Italian small caps have risen by just over 30% this year compared to the UK at 6%, Sweden at –2% and French counterparts at –4%. All measured in local currency.
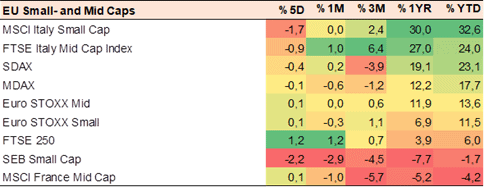
Source: Coeli European
With around 50% of the capital invested in the two markets that have had the weakest development this year (Sweden and the UK), the fund has clearly had some headwinds. With good stock selection, there should be a good chance that this year's development will reverse.
The world's central banks are wide open to lowering key interest rates. Not since the Covid crash of 2020, have we seen such a collective dovish policy. Positive!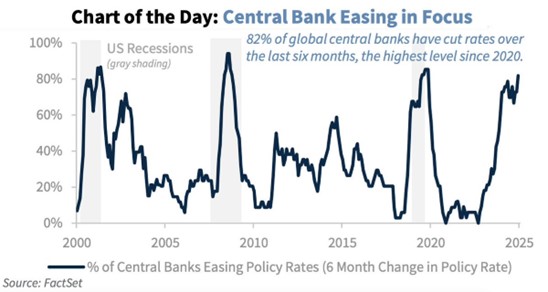
This has contributed to a rising risk appetite that is now at elevated levels.
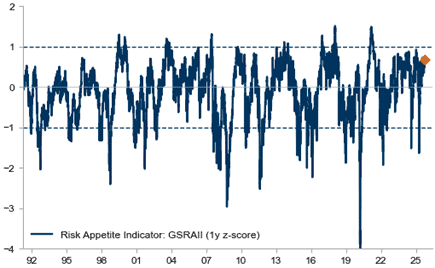
Source: Goldman Sachs
Finally, the Fed also lowered its key interest rate in September and the picture shows the historical development of the S&P500 after the first interest rate cut. If the economy continues to grow, the stock market has risen by about 15%. More cuts are anticipated in the coming months.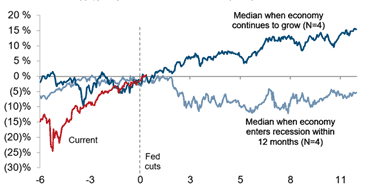
Source: Goldman Sachs
In line with falling interest rates, the IPO market has also gotten off to a good start. Below shows the return on the first trading day isolated (for the US) which is up in the high 30%, which in turn is in the 87th percentile measured over 30 years.
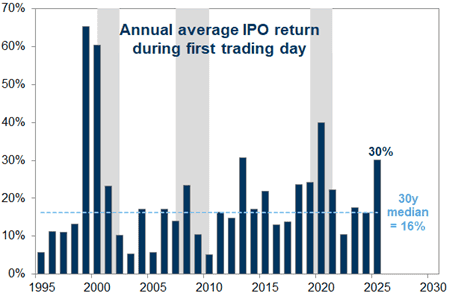
Source: Goldman Sachs
With a strong capital market, Sweden is at the top of the list when it comes to raising capital for European IPOs. Next week, Verisure will be listed on the Stockholm Stock Exchange, bringing the total capital raised this year to around USD 7 billion. The expected market capitalisation is around SEK 150 billion, which is by far the largest IPO in Europe this year. We hope for a good allocation for this fine business.
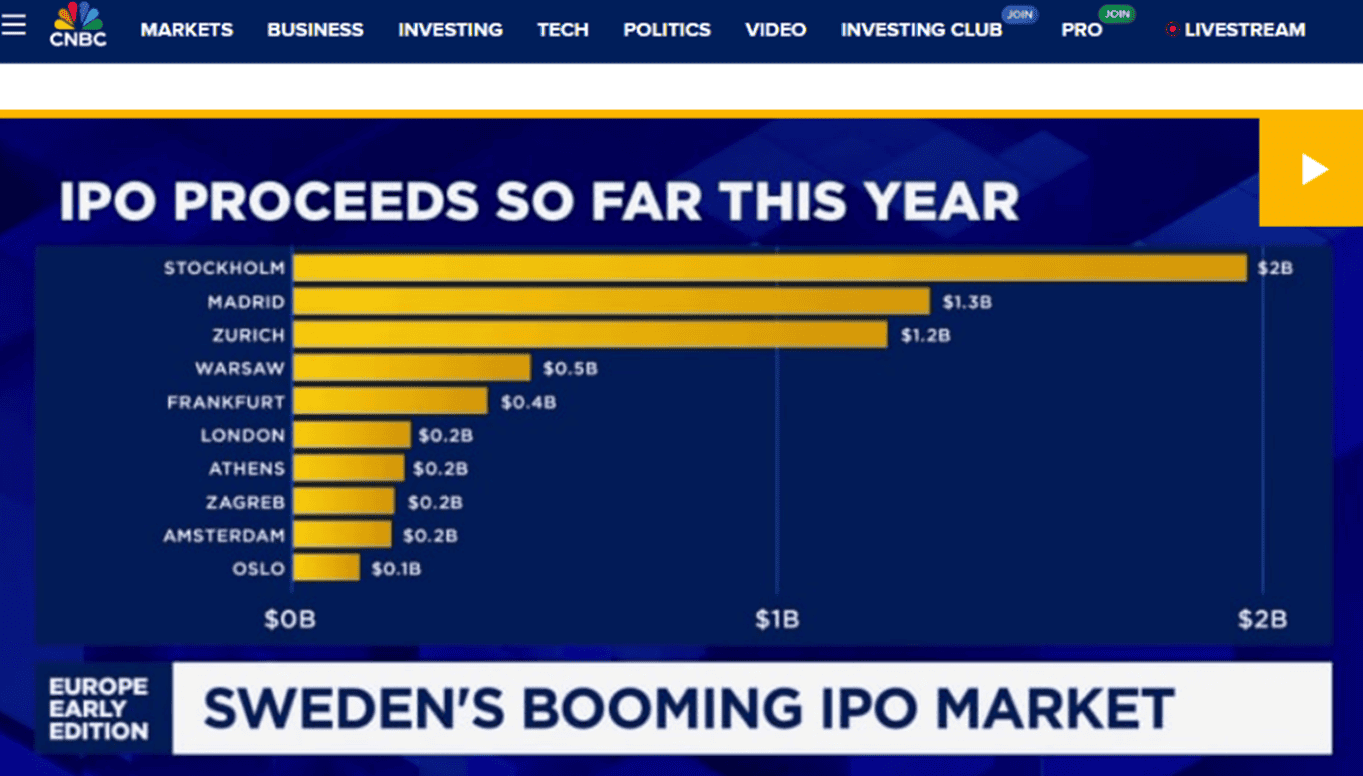
Source: CNBC
Source: HEDGEYE
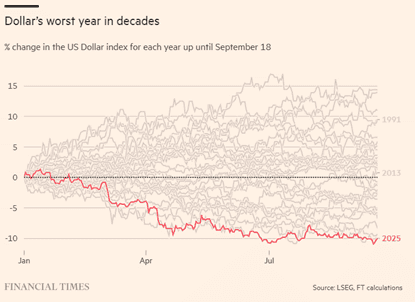
It must be said that the administration is doing an excellent job – at least when it comes to weakening the currency.
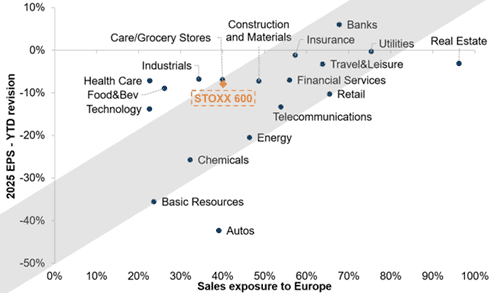
The weak dollar has left a clear mark on expected profit growth among European companies. The figure below shows changes in expected profit growth during the year. The top line shows companies with a high proportion of domestic operations, where estimates have risen two percent. The light blue line shows the development for European companies with a high proportion of American operations, where estimates have fallen 12–13%. This is one of the reasons why we view the development positively for smaller companies, which typically have a higher domestic exposure and have significantly fewer problems with a falling dollar and rising tariffs.
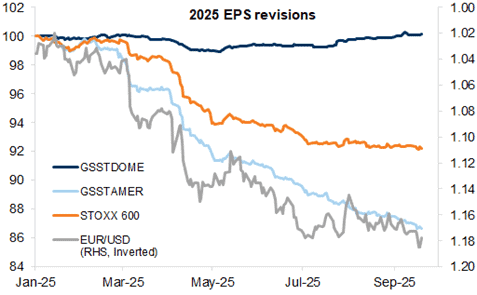
Source: Goldman Sachs
Europe, like the US, has its political challenges – albeit in different directions. The Financial Times wrote a week ago that French companies' borrowing costs are now in many cases lower than those of the French state. As we have said many times, you can kick and scream all you want, but if you are in debt, you will eventually have to get in line. To be continued.
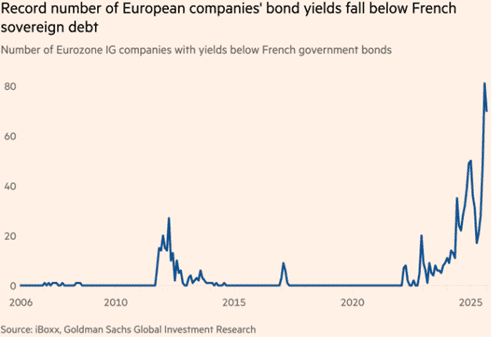
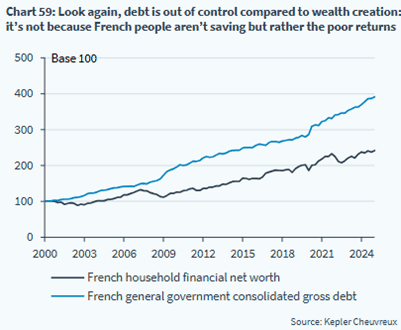
The picture below reflects the problems France has. It is time to address the structural problems before it is too late.
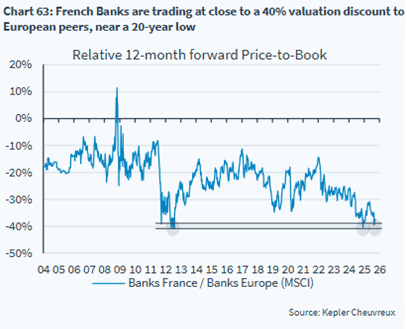
The market clearly did not approve, – 40% discount on French banks.
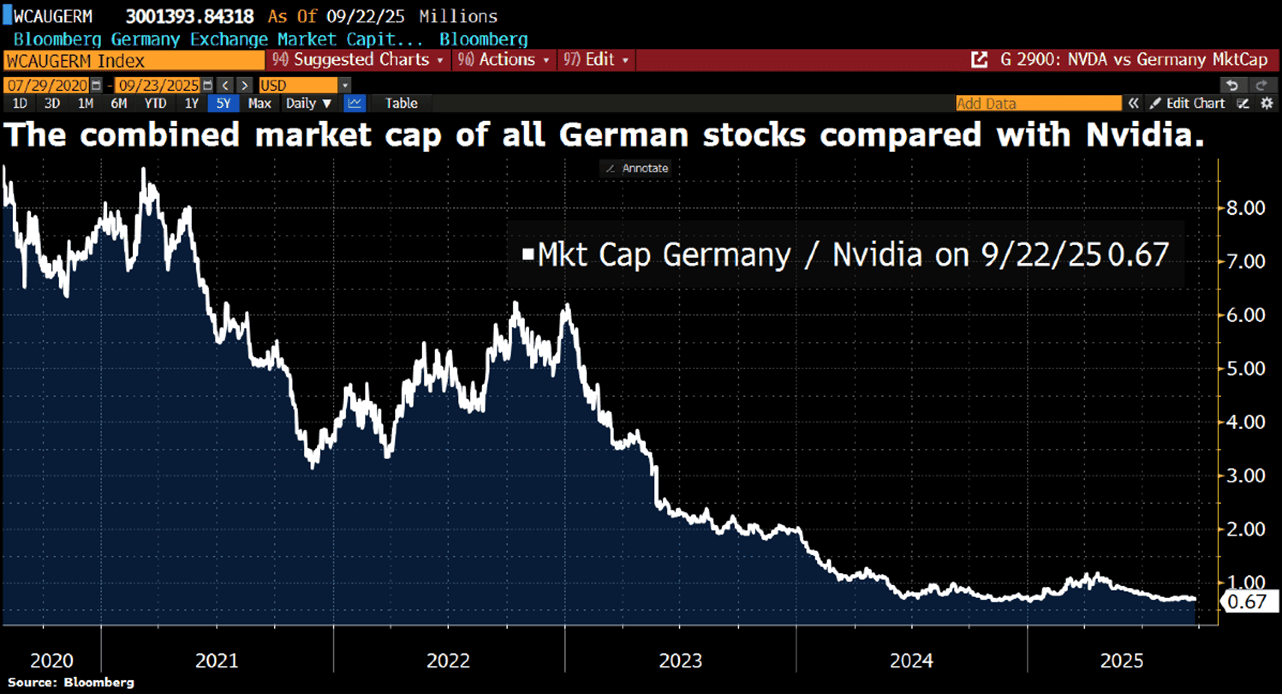
Three years ago, the combined value of German listed companies was 6 times greater than Nvidia. Now the ratio is 0.67x. Almost hard to fathom.
Source: Bloomberg
We are big fans of AI and everything that will come out of that development. But at the stock level and when it looks like it does in the picture below, it usually doesn't end well. Not to be confused with real-world technological successes.
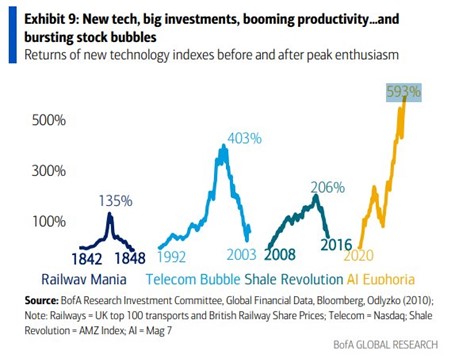
This is not good, and no one is really surprised. The time series is over 30 years.
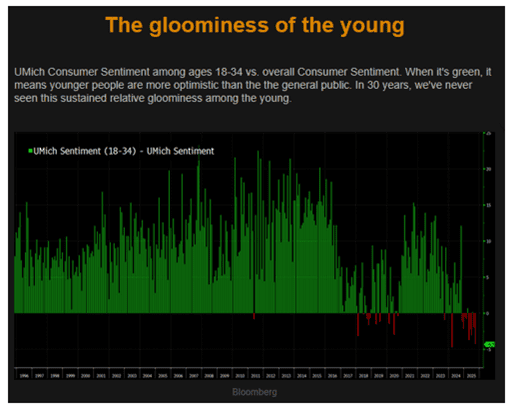
Source: Bloomberg
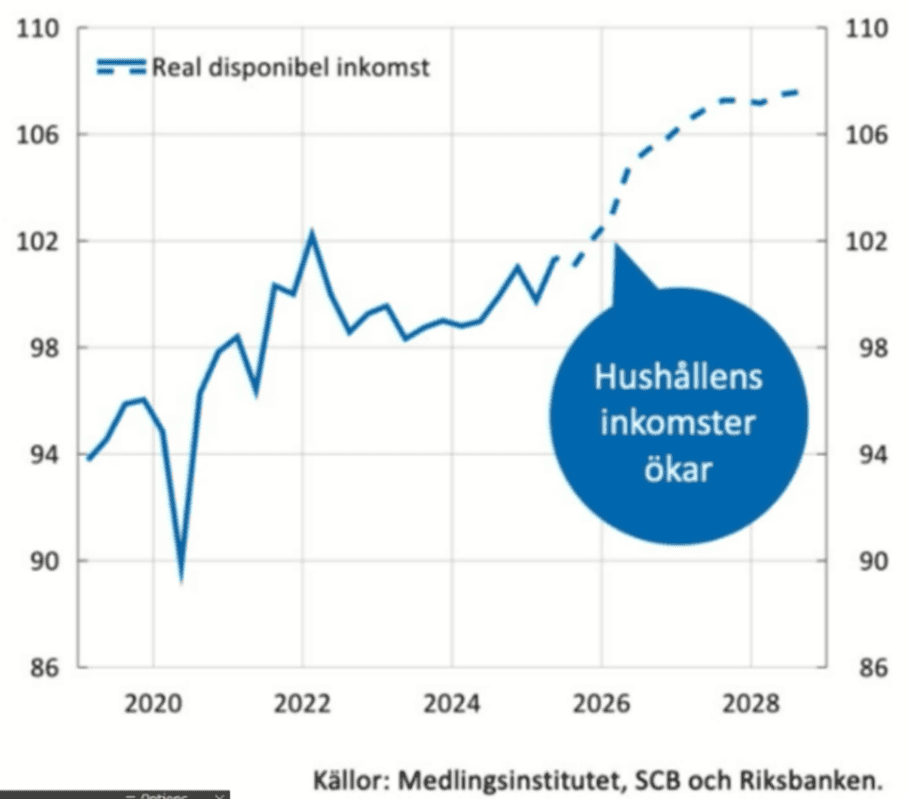
A much more pleasant picture is the one below, which shows a long-awaited increase in disposable income in Sweden. Wage increases, lower tax burden and interest rates are a nice cocktail for the hard-pressed Swedish consumer. In August, the Swedish retail index also rose 4.4% on an annual basis – promising!
PORTFOLIO COMPANIES
Trigano
Since early summer 2025, we have been invested in Europe's largest manufacturer of motorhomes: Trigano. After many years of several acquisitions, the product portfolio today consists of just over 25 brands. The majority of Trigano's products are aimed at the low-price segment, the largest and currently fastest growing segment. Around 85% of sales come from motorhomes. The remainder comes from several smaller product areas, such as caravans, trailers and other related products.
The motorhome market probably doesn't sound particularly exciting. But an aging population speaks in favor of the segment and provides some structural growth. Most first-time buyers of motorhomes are often 55 years or older. A (stereo-)typical customer re-mortgages or sells their home and buys a caravan as an alternative to a country cottage. The market is not a distinct luxury segment - price is much more important than brand. The luxury segment within the motorhome market is small in relation to the low-price segment, where Trigano is most active.
Supported by an ingenious business model and an active acquisition agenda with clear purchasing synergies, Trigano has achieved a CAGR of 15% over a ten-year period. The management model is highly decentralized, but with synergies in purchasing specifically. Around 40–50% of the manufacturing cost of a motorhome comes from the chassis. Most of the chassis in the European motorhome market are manufactured by Fiat (where Trigano's CEO previously worked, by the way). As Trigano has acquired companies, it has been able to negotiate better purchasing terms with Fiat and other suppliers. With a high market share of close to 30%, Trigano is an important customer for its suppliers.
Trigano has used its strong negotiating position with suppliers to lower its costs and in turn passed on the savings to its customers in the form of ever lower prices. This has in turn led to Trigano continuously increasing its market share. Over the past year, Trigano's already high market share has increased by 3 percentage points. Recently, management mentioned that they have lowered their prices for three years in a row on new products. With the inflation we have seen in recent years, this clearly sounds unexpected.
Our view is that Trigano's aggressive pricing strategy is bearing fruit. Recently, Knaus Tabbert, a market leader in Germany, issued a profit warning, citing increased price pressure, which is said to have been driven by strong competition. The American giant Thor Industries recently released a report mentioning similar phenomena, and highlighted, among other things, that the low-price segment (where Trigano is the largest) is taking market share.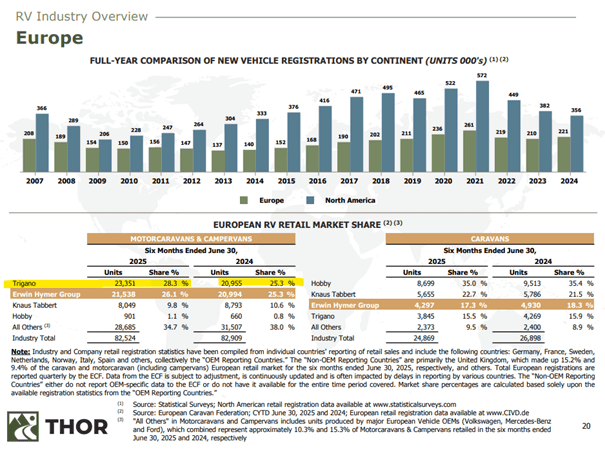
When Trigano released a sales update in September for the quarter ending August, its guidance for profitability was below expectations. However, cash flow was strong and the outlook for the coming year was very positive. Order intake has increased by over 10% and in the end-market we see motorhome registrations increasing nicely. The share rose 6% on the reporting date but by the end of the month had still fallen 2% for September as a whole.
The risks in Trigano are not non-existent. There is no getting away from the fact that this is a cyclical share, although we believe that the end-market is probably more stable than one might think. In addition, Trigano's largest market is France, where we are currently seeing political turbulence. If the turbulence worsens or remains at an elevated level for a long time, it will likely have a negative impact on French consumer confidence. However, we believe that this is more than well priced into today's valuation, which is below P/E 10x for next year on our estimates (corresponding to EV/EBIT 6x).
Babcock
Our investment in Babcock has been successful during the year. After a price surge of 31% in September, it was the fund's brightest star during the month. First, at the end of the month Babcock provided a positive update for the financial year so far. Second, several collaborations and orders were announced. But above all, the share probably rose on the (expected but still sad) news indicating that the war in Ukraine is far from over. It is becoming increasingly clear that Trump's peace discussions with Putin have stalled.
SLP
SLP was one of the fund's best stocks in September. The company was included in the EPRA index, an index that tracks European real estate companies. Nordea noted that real estate stocks that are included tend to outperform their benchmark index by 8% three months after inclusion. The stock rose nearly 3% in September, and we still think it is undervalued in terms of cash flows and growth prospects. Since the beginning of the year, SLP has risen 3% while Swedish real estate (SX35GI) has fallen just over 10%.
Kalmar and Hiab
Our Finnish engineering companies had a tougher time in September. Investors are concerned about the general development in the US. On top of this, Trump expanded Section 232 tariffs. These now include certain “finished” goods with high steel and aluminum content. Several of both Kalmar’s and Hiab’s competitors have the same concerns. When the first tariffs were announced in April, our opinion was that the market was more concerned about the cost situation than demand. Today, the picture is probably the opposite.
After the decline, both shares look appealing with EV/EBIT 10-11x for Hiab and 9x for Kalmar on next year’s forecasted profit. Kalmar fell about 14% in September. Hiab fell about 12%.
SUMMARY
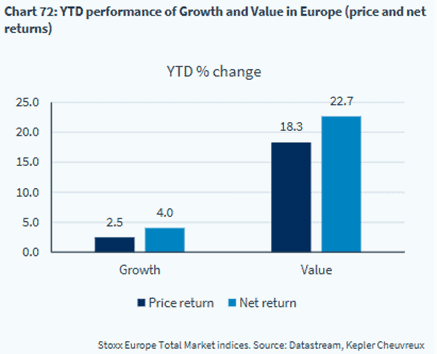
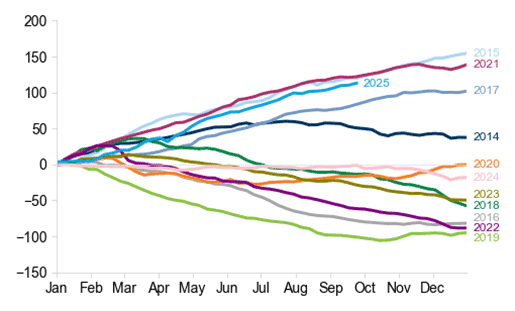
This year, European stock markets have been characterized by large, often hidden movements. We have previously highlighted currency movements and significant geographical differences. Within sectors, European growth areas – such as technology, pharmaceuticals and luxury – have developed notably weaker than value sectors, with banking once again standing out by far as the strongest. The picture below shows that only industrials have developed strongly, and this is largely due to the defense companies, which have had a strong year.
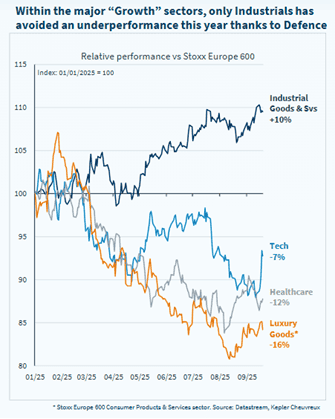
Source: Datastream, Kepler Cheuvreux
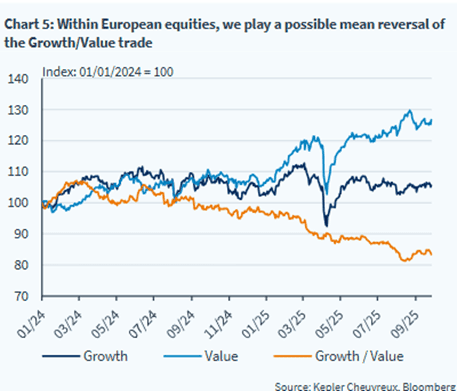
The chart below illustrates the relationship between growth and value stocks. In the US, we see a completely opposite development.
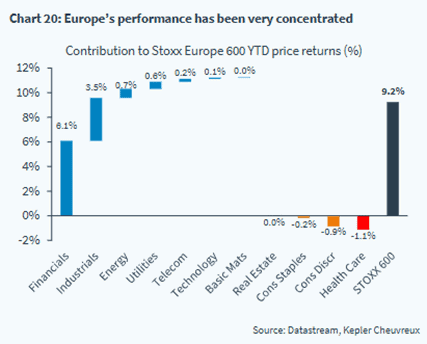
Banking is by far the biggest contributor to the Stoxx600's return this year. Industry and insurance also help a little, but otherwise most of it is in negative territory.
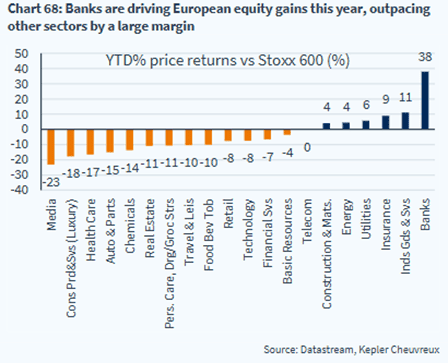
2/3 of the year's return in Europe comes from bank stocks. The fund has spent most of the year invested in Commerzbank, which was recently divested, while we retain our position in Austrian Bawag.
A clear difference in returns this year between value and growth stocks, to say the least.
A good picture that shows the advantage this year of having domestic exposure.
Source: Goldman Sachs
The American economy is resilient.
Source: BNP Paribas
Below is an interesting picture showing the actual realized growth in earnings per share over a three-year period, expressed as an average annual growth rate. Since 1991, the S&P500 has grown by 6% per year compared to MSCI Europe which has grown by 5%, measured in USD. Filtering out tech companies, growth in other companies in the US has only been 2%. Surprising, at least for me.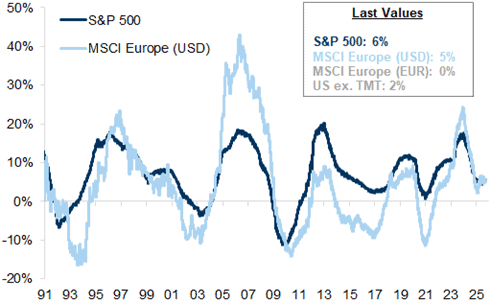
Source: Goldman Sachs
Inflows to European stock markets have been unusually strong so far this year.
Source: Goldman Sachs
The images below show that valuations in Europe remain attractive. Measured in USD and since 2020, the Stoxx600 has had a stronger development than the “S&P493” (excluding the large tech companies). We guess that comes as a surprise to our readers.
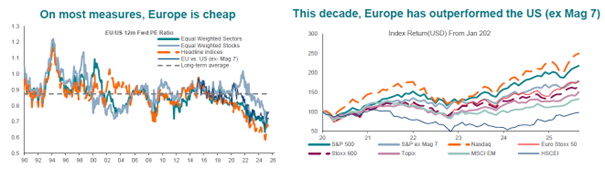
Source: BNP Paribas
The S&P500 has risen more than profits this year and the image on the right, with data from 1991, indicates that the air is starting to get thin.
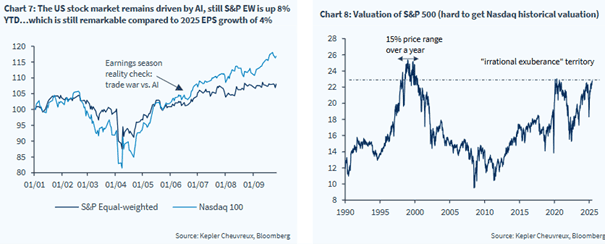
The concentration risk in the US has never been greater.
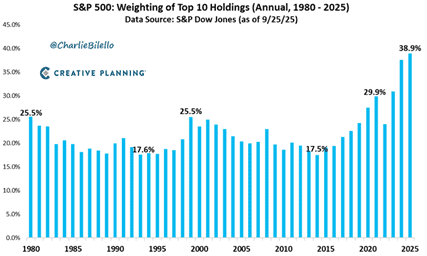
Source: @CharlieBelello, CREATIVE PLANNING
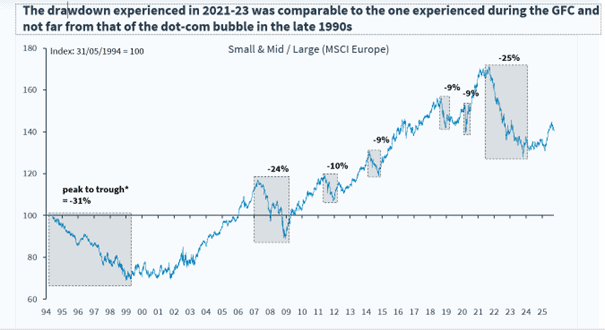
As previously mentioned, the development for European small caps has been somewhat weaker recently. However, we see good reasons to believe in a recovery during the fourth quarter.
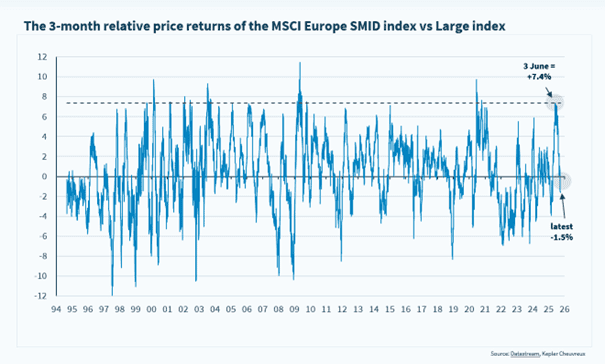
Source: Datastream, Kepler Cheuvreux
The relationship in returns between small/mid-sized companies and large companies.
Source: Kepler Cheuvreux
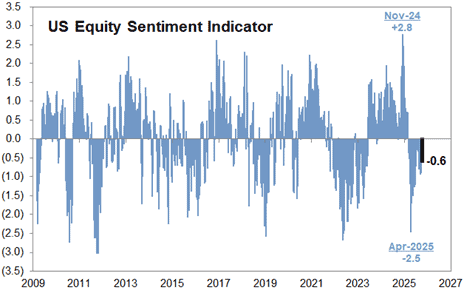
Many probably expected September, as so often before, to be marked by turbulence – but that was not the case. The pain trade has continued to be high, as can be seen in the picture below where investor exposure remains low.
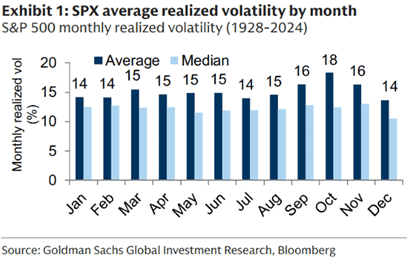
The last picture; with data from 1928, October is undoubtedly the month with the highest volatility. It also tends to pay off for risk-on, as the last months of the year are among the best in terms of returns.
The world's central banks are currently busy cutting interest rates, while many governments – not least in Europe – are either maintaining or launching significant investment programs.
Inflation is under control in most Western countries. AI is driving technological development at a furious pace, regulations are decreasing, and oil prices are at low levels. To sum it up, mildly, conditions could be significantly worse.
That's all for now – now we are really looking forward to a new reporting season!
Mikael & Team
Malmö, 3rd of October 2025
IMPORTANT INFORMATION. This is a marketing communication. Before making any final investment decisions, please refer to the prospectus of Coeli SICAV II, its Annual Report, and the KID of the relevant Sub-Fund. Relevant information documents are available in English at coeli.com. A summary of investor rights will be available at https://coeli.com/financial-and-legal-information/.
Past performance is not a guarantee of future returns. The price of the investment may go up or down and an investor may not get back the amount originally invested. Please note that the management company of the fund may decide to terminate the arrangements made for the marketing of the fund in one or multiple jurisdictions in which there exists arrangements for marketing.
